Australia & New Zealand sponsorship data analysis report
IMR Publications has published an in-depth analysis of the sports sponsorship market in Australia and New Zealand to date. It lists 1,662 deals with either reported values or estimates to provide the reader with a clear picture of who sponsors which sport and how much they pay. The data is further analysed using 82 charts and tables to show detailed analysis and trends by sport, by industry sector, by company and by international source of sponsorship investment.
Key issues identified include:
·Australian sponsorship worth $735 million per year
·New Zealand market worth $145 million
·Biggest deal in rugby union at $25 million
·Aussie Rules brings in $135 million
·Financial services spend less than in most countries
·Car manufacturers big investors
·Alcohol still a major player in Australia despite Government programme to replace it
·Tennis still big earner despite lack of domestic success
IMR has kindly allowed us to publish some extracts…just a few pages of the 129 page report which contains amazing information.
A link to the report page is embedded here, click here to go to that page from where you can purchase the report.
Australia / NZ sponsorship analysis by company
Table 12. Australia / New Zealand sponsorship analysis by company
|
Company |
Number of deals |
Total deal value (US$m) |
Average deal value (US$m) |
|
Adidas |
8 |
27.7 |
3.46 |
|
Telstra |
3 |
21.325 |
7.11 |
|
Foxtel |
3 |
21.175 |
7.06 |
|
Coca-Cola Amatil |
33 |
18.1 |
0.55 |
|
Commonwealth Bank |
3 |
13.32 |
4.44 |
|
Toyota |
9 |
12.5 |
1.39 |
|
AIG |
1 |
12.4 |
12.40 |
|
Kia |
2 |
12.04 |
6.02 |
|
Emirates |
5 |
11.4 |
2.28 |
|
Carlton Draught |
8 |
10.8 |
1.35 |
|
ANZ |
7 |
10.415 |
1.49 |
|
Ford |
10 |
9.56 |
0.96 |
|
Holden |
7 |
8.98 |
1.28 |
|
VB |
9 |
6.62 |
0.74 |
|
Qantas |
9 |
6.6 |
0.73 |
|
Rolex |
3 |
6.5 |
2.17 |
|
Nab |
5 |
6.28 |
1.26 |
|
Etihad |
2 |
6 |
3.00 |
|
Virgin Australia |
8 |
5.91 |
0.74 |
|
Hyundai |
10 |
5.73 |
0.57 |
|
Suncorp |
4 |
5.56 |
1.39 |
|
Nike |
5 |
5.275 |
1.06 |
|
Bet 365 |
2 |
5.06 |
2.53 |
|
Red Bull |
5 |
4.75 |
0.95 |
|
ITM |
2 |
4.5 |
2.25 |
|
Optus |
3 |
4.35 |
1.45 |
|
Westpac |
5 |
4.35 |
0.87 |
|
Fujitsu |
2 |
4.3 |
2.15 |
|
Air New Zealand |
2 |
4.2 |
2.10 |
|
Toll |
2 |
4.15 |
2.08 |
|
BNZ |
3 |
4.11 |
1.37 |
|
BigPond Unmetred |
1 |
4 |
4.00 |
|
Investec |
1 |
4 |
4.00 |
|
Jack Daniels |
1 |
4 |
4.00 |
|
Mastercard Worldwide |
1 |
4 |
4.00 |
|
Pepsi Max |
1 |
4 |
4.00 |
|
KooGa |
8 |
3.975 |
0.50 |
|
Supercheap Auto |
3 |
3.9 |
1.30 |
|
AAMI |
6 |
3.875 |
0.65 |
Australia / New Zealand sponsorship analysis
Table 7. Australia / New Zealand sponsorship spend overview
|
Country / Region |
Number of deals |
Number of deals (%) |
Total deal value (US$m) |
Total deal value (%) |
Average deal value (US$m) |
|
Australia |
1405 |
84.5% |
613.73 |
83.5% |
0.44 |
|
New Zealand |
257 |
15.5% |
121.00 |
16.5% |
0.47 |
|
Grand Total |
1662 |
100.0% |
734.72 |
100.0% |
0.44 |
Table 8. Comparative GDP – Australia and New Zealand
|
Australia (2012) |
|
|
New Zealand (2011) |
|||
|
Total |
$960.722 billion |
89% |
|
Total |
$122.193 billion |
11% |
|
Per capita |
$42,354 |
|
|
Per capita |
$27,668 |
|
The main analysis of sponsorship in Australia and New Zealand will be presented in specific country sections later in the report. However, because there are several sports events that cover the two countries (such as Super Rugby, the A-League and V8 Supercars) it is useful to consider the overall picture in the two countries.
Interestingly, an analysis of the respective GDPs of Australia and New Zealand shows that sponsorship rights spend is proportionally very similar. Australia, having a gross domestic product of 89% of the combined total of the two countries, accounts for 84.5% of sponsorship value.
This finding is surprising given that Australia has five major professional sports leagues whereas New Zealand has only rugby union and, to a much lesser extent, cricket at the fully professional level.
As mentioned earlier the value in New Zealand’s sponsorship rights is boosted by the huge deals secured by the NZRU for the All Blacks, which account for an estimated $76 million (63%) of the country’s $121 million total, an unprecedented proportion in western nations. The Emirates Team New Zealand America’s Cup deal hasn’t been included in this report because it is considered to be mainly an international sponsorship. Although it obviously has an element of its marketing targeted at New Zealand, the 2013 event is taking place in San Francisco and will be broadcast around the World. As such including the deal (thought to be worth in the region of $50 million), would skew the findings considerably. The All Blacks deals are included because New Zealanders identify very strongly with rugby union and with the national team and Adidas’s massive sponsorship is largely linked to shirt sales, which are predominantly targeted at New Zealand nationals.
This single rights holder has pushed the overall value of rugby union to second spot among the combined countries’ sponsorship income (behind Australian Rules Football) and helped to develop the sports marketing industry in New Zealand.
Australia – sponsorship analysis by sport
Table 13. Australian sponsorship analysis by sport
|
Sport |
Number of deals |
Number of deals (%) |
Total deal value (US$m) |
Total deal value (%) |
Average deal value (US$m) |
|
Australian Rules Football |
233 |
16.6% |
135.78 |
22.1% |
0.58 |
|
Rugby League |
271 |
19.3% |
86.80 |
14.1% |
0.32 |
|
Motorsport |
100 |
7.1% |
75.75 |
12.3% |
0.76 |
|
Soccer |
182 |
13.0% |
61.97 |
10.1% |
0.34 |
|
Cricket |
125 |
8.9% |
52.64 |
8.6% |
0.42 |
|
Tennis |
109 |
7.8% |
44.85 |
7.3% |
0.41 |
|
Rugby Union |
80 |
5.7% |
29.61 |
4.8% |
0.37 |
|
Horseracing |
50 |
3.0% |
18.96 |
2.6% |
0.52 |
|
Golf |
46 |
3.3% |
17.10 |
2.8% |
0.37 |
|
Multi-purpose |
11 |
0.8% |
16.23 |
2.6% |
1.48 |
|
Olympics |
19 |
1.4% |
15.10 |
2.5% |
0.79 |
|
Swimming |
8 |
0.6% |
13.27 |
2.2% |
1.66 |
|
Hockey |
11 |
0.8% |
8.65 |
1.4% |
0.79 |
|
Basketball |
12 |
0.9% |
7.65 |
1.2% |
0.64 |
|
Yachting |
11 |
0.8% |
7.10 |
1.2% |
0.65 |
|
Rugby |
1 |
0.1% |
5.00 |
0.8% |
5.00 |
|
Athletics |
47 |
3.3% |
4.63 |
0.8% |
0.10 |
|
Cycling |
22 |
1.6% |
4.06 |
0.7% |
0.18 |
|
Surfing |
33 |
2.3% |
3.79 |
0.6% |
0.11 |
|
Netball |
19 |
1.4% |
3.38 |
0.5% |
0.18 |
|
Winter Sports |
1 |
0.1% |
1.00 |
0.2% |
1.00 |
|
Baseball |
13 |
0.9% |
0.41 |
0.1% |
0.03 |
|
Snowsports |
1 |
0.1% |
0.08 |
0.0% |
0.08 |
|
Grand Total |
1405 |
100.0% |
613.73 |
100.0% |
0.44 |
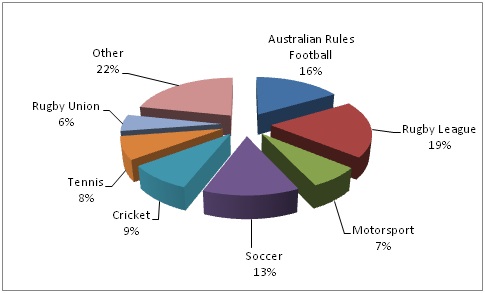
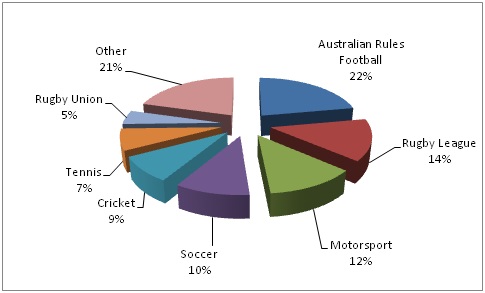
As previously discussed, Australian Rules Football is the biggest sport in Australia by popularity and this is reflected in the overall sponsorship income table. When analysing sport by sponsorship spend, rugby league remains in second place but motorsport jumps above soccer, cricket and rugby union based on the high commercial values that motorsport teams achieve.
This is a reflection of the greater levels of media exposure delivered in motorsport. Logos are generally large, whether trackside or on vehicles, and frequently on screen during televised races. Brand exposure delivered in, for example, cricket is much more subtle and rights fee value depends more on the benefits of the link to the sport and the activation opportunities.
Horseracing sponsorships in this report are limited to the major events and facilities for the simple reason that there are thousands of sponsored races each year and including them all would require a dedicated report.
Chart 11. Australian sponsorship analysis by sport by number of deals
Chart 12. Australian sponsorship analysis by sport by value of deals
Many thanks to IMR Publications.


